Quick Analysis Feature in Excel

Documentation

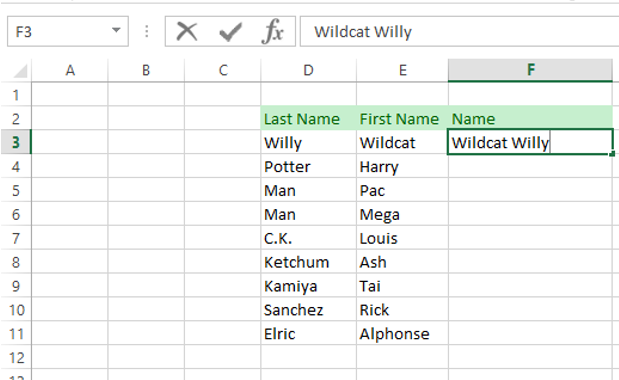
Excel offers many tools for you to organize your data. The Quick Analysis tool will quickly analyze and visualize data for you.
Below is a step-by-step instruction on how to use it:
 

1. With your data selected, open the Quick Analysis tool by pressing Ctrl + "Q."


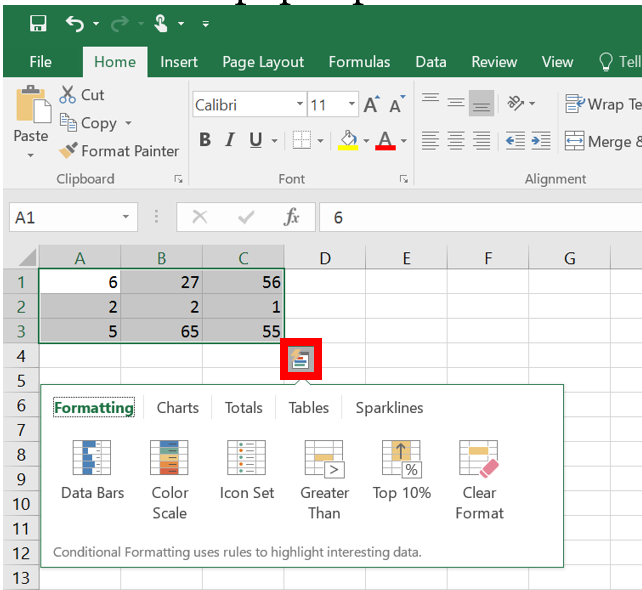
2. Select the tab you would like to use (sparklines, formatting, tables, etc.) and hover over the options to see a preview. Note that these methods will be different depending on the nature of the data you've selected. 


3. Click on your choice to create a visualization in a new worksheet. 

Flash Fill Feature in Excel

Documentation

Excel offers many tools for you to organize your data.The Flash Fill option will help you format your data quickly.
Below is a step-by-steb guide on how to setup and use Flash Fill.
 

1. Type in the first selection of data the way you would like it to be formatted. In this case, we're concatenating two strings of text.


2. Once you start typing the second selection, Excel will detect what you're trying to do and will provide a preview for the rest of the data formattted this way. 


3. Press Enter and the rest of the data will auto-fill using the Flash Fill feature. 


4. To Accept or Undo Flash Fill actions, click on the small box that appears next to the area that was filled. 
    

Subscribe to data